Something strange is happening in a lot of UK marketing reports. Sessions are down, sometimes sharply. Enquiries are flat or rising. The instinct is to treat the traffic decline as the real story and the enquiries as luck. That reading is backwards, and acting on it is expensive.
- Nearly 68% of Google searches now end without a click, rising to 93% when AI Mode is active.
- With an AI Overview present, UK data shows first-result click rate falling from 27% to 11%, so you can hold rank one and lose half your clicks.
- Traffic became a worse proxy for demand. Demand did not fall, and your reporting needs to reflect that.
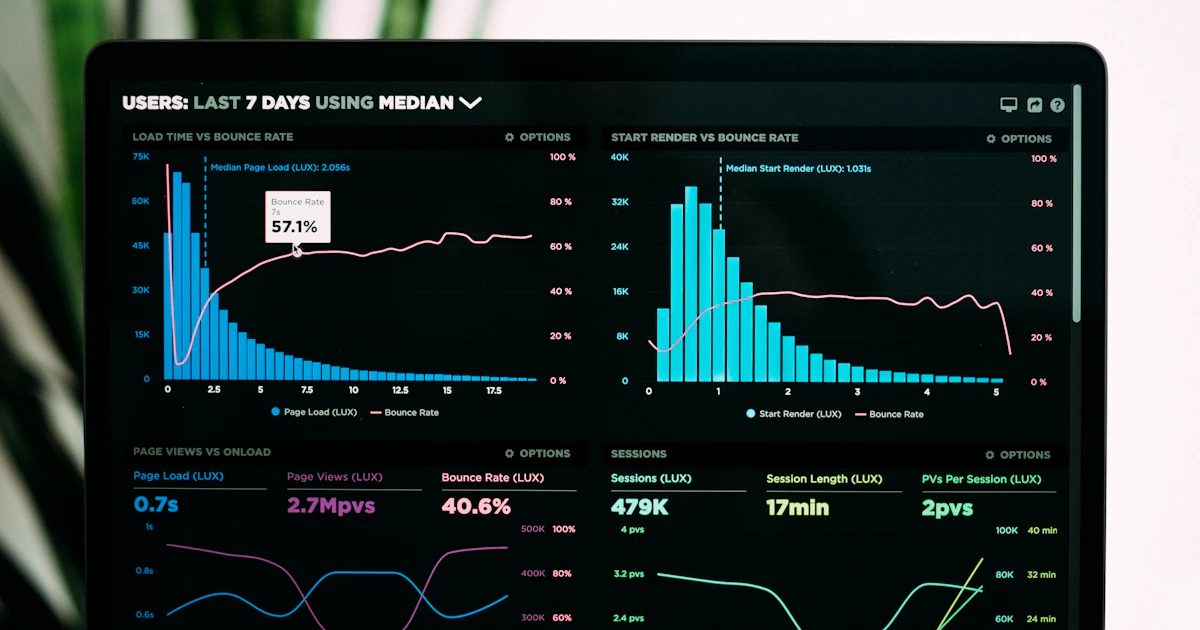
For twenty years, sessions were a reasonable stand-in for commercial interest. More people arriving meant more people considering you, and the relationship held well enough that nobody had to think about it. That relationship has broken. Not weakened, broken, and the businesses making cuts based on a traffic chart are cutting the things that are still working.
Why this matters now
The numbers are unambiguous. Nearly 68% of Google searches now end without a click to any website, and that figure rises to around 93% when Google's AI Mode is active. Almost half of searches display an AI Overview. When one appears, UK data shows the click rate on the first organic result falling from 27% to 11%, which means you can hold the top position, lose more than half your clicks, and have done nothing wrong.
Different studies size the effect differently, which is worth knowing so you are not caught out by a conflicting statistic. Pew measured 8% clicks with an AI Overview against 15% without. Ahrefs found 58% lower click rate on the top-ranking page for AI Overview keywords in one study and a 34.5% average drop across 300,000 searches in another. The methodologies differ and the exact figure is contested. The direction is not.
The impact is also uneven by sector, which matters when you are benchmarking. Ecommerce traffic has held up reasonably. Technology and publishing have taken larger hits. Healthcare sites have seen drops as steep as 70% while ecommerce sees around 30%. For local service businesses the effect is mild, because only around 8% of local searches trigger an AI Overview at all. Informational queries are where the damage concentrates.
Here is the part that changes what you should do. The people who no longer click have not stopped needing what you sell. They resolved a question inside the search interface and will return later with a more specific intent, or they will arrive already knowing who you are. The visits you still receive are, on average, further down the buying process than the ones you lost. Fewer visitors converting at a higher rate is not a failure. It is what the funnel looks like now.
There is early evidence of stabilisation too. Seer Interactive found click rate for AI Overview searches recovering to around 2.4% by early 2026, suggesting the initial shock was sharper than the settled state. Planning for permanent catastrophe is as wrong as pretending nothing happened.
Common mistakes to avoid
Almost every mistake here comes from continuing to treat a broken proxy as if it still worked.
- Cutting the channel that still produces enquiries. The most expensive error available. Traffic falls, someone proposes reducing content or SEO spend, and the business cuts the thing generating the enquiries it is still receiving. Check enquiry attribution before touching a budget.
- Setting traffic growth targets. A target of 20% session growth commits your team to fighting a structural trend. They will hit it by chasing low-intent volume that never converts, which is worse than missing it.
- Reading rank as visibility. You can be first and be beneath an AI Overview that answers the question completely. Rank tracking now measures position in a race that fewer people finish.
- Blaming the website for a search-behaviour change. Redesigning a site that is converting well because sessions fell is an expensive answer to a question nobody asked.
- Ignoring it completely. The opposite error. Zero-click is real and it does reduce the top of your funnel. The response is different measurement and better mid-funnel work, not denial.
There is a specific reporting failure worth calling out. Most businesses still cannot say where their enquiries came from. If 40% of your conversions arrive by phone and you do not track calls, your attribution is guesswork before AI search is even considered. Adding a single how did you hear about us field to your enquiry form will teach you more in a month than a year of session analysis, and our guide to the conversion fixes most sites are missing covers where those enquiries tend to leak away.
The deeper issue is that the traffic number was always a proxy for something else, and nobody minded because it correlated well. Now that it does not, the honest response is to measure the thing you actually cared about. That was never sessions. It was qualified enquiries.
Quick Strategic Tip
Put sessions and enquiries on the same chart, indexed to 100 at the start of the period. If the lines have diverged, you have your answer and you can stop arguing about it. That one chart has settled more marketing disputes than any dashboard I have seen, and it takes ten minutes to build.
Step-by-step plan to fix your reporting
This takes about three weeks and needs no new software for most businesses. The aim is a report that tells you the truth even when the traffic line is falling.
- Define your commercial outcome precisely. Not traffic, not leads, but the specific event that matters: a qualified enquiry, a booked call, a quote request. Write the definition down so everyone reports the same thing.
- Instrument every enquiry route. Forms are usually tracked. Phone calls usually are not, and they can be around 40% of conversions. Email links, WhatsApp and chat all count. Any route you cannot see will be credited to nothing, which means it will look like it is not working.
- Add a self-reported attribution field. One optional question on the enquiry form: how did you hear about us. Self-reported attribution is imperfect and it is still the most reliable signal available in a zero-click world, because it captures the journeys analytics cannot see.
- Separate branded from non-branded in Search Console. Branded query growth is now one of your best available proxies for awareness. If people who never clicked are later searching your name, your content is working even though the sessions do not show it.
- Rebuild the headline report around three numbers. Qualified enquiries, cost per qualified enquiry, and conversion rate from session to enquiry. Sessions become context, reported underneath, not the headline.
- Track impressions alongside clicks. Impressions tell you whether you are still being surfaced. If impressions hold and clicks fall, you have a zero-click effect rather than a visibility problem, and those need completely different responses.
- Set up a monthly cohort view of enquiry quality. Volume alone will mislead you. Track how many enquiries progressed to a real conversation and how many closed. Rising quality with falling volume is a good quarter.
- Review your content mix against the new reality. Purely informational content that AI answers completely will earn fewer clicks. Content demonstrating your process, pricing logic and outcomes still pulls people through because it cannot be summarised away. Our AI search visibility playbook covers how to structure for citation rather than clicks.
- Brief everyone who reads the report. The reporting change fails if your board still asks about sessions. Explain the shift once, clearly, with the divergence chart, before the first new report lands.
- Re-baseline and stop comparing to 2024. Year-on-year session comparisons that span the AI Overview rollout are not measuring your performance. Set a new baseline from the start of this year and measure against that.
Step three does the most work for the least effort. A single optional form field, reviewed monthly, will show you referral and word-of-mouth journeys that no analytics package can attribute, and those journeys have grown as click-through has fallen.
Reporting checklist
A report that survives the zero-click era should satisfy all of these.
- The headline number is a commercial outcome, not a traffic figure.
- Every enquiry route is instrumented, including phone calls.
- A self-reported attribution field is live on the enquiry form.
- Branded and non-branded search performance are reported separately.
- Impressions are reported alongside clicks.
- Enquiry quality is tracked, not just enquiry volume.
- Conversion rate from session to enquiry appears on the front page.
- No target is set for session growth.
- The baseline period starts after the AI Overview rollout.
- Everyone who reads the report understands why it changed.
How to measure what matters now
Three tiers, in descending order of reliability. Weight your decisions accordingly.
Tier one, commercial reality. Qualified enquiries, progression to conversation, closed business, and self-reported attribution. These are the numbers to make decisions from. They are harder to collect and they are the only ones that survive a change in how search works.
Tier two, engagement. Conversion rate, engagement time on key pages, scroll depth to proof sections, and returning visitor share. These tell you whether the visits you still get are the right ones. If sessions fall 30% and conversion rate rises 40%, your traffic got better, not worse.
Tier three, visibility. Impressions, branded query volume, and share of relevant queries where you appear at all. Useful directionally, unreliable individually. Watch the trend over quarters and ignore the week-to-week movement.
Sessions belong nowhere in that hierarchy as a headline. Keep the number for context, because a sudden collapse still signals a technical problem worth investigating. Just stop treating it as the score.
One caution on benchmarking: the sector variation is wide enough that generic figures will mislead you. A 30% ecommerce decline and a 70% healthcare decline are both normal. Compare yourself to your own trend, not to a headline statistic from a different industry.
Key terms in plain English
Zero-click search: A search that ends without the user visiting any website, because the answer appeared in the results.
AI Overview: Google's AI-generated summary at the top of results. Present on roughly half of searches, and it substantially reduces clicks to the results beneath it.
AI Mode: Google's fully conversational search experience, where around 93% of sessions end without a click.
Branded query: A search containing your business name. Growth here suggests awareness rising even when non-branded clicks fall.
Impressions: How often you appeared in results, clicked or not. The best remaining proxy for visibility.
Self-reported attribution: Asking customers directly how they found you. Imperfect, and currently the most useful attribution method available.
Qualified enquiry: An enquiry meeting your definition of a real prospect. The definition matters more than the tooling.
Conclusion and next move
Traffic stopped being a good proxy for demand somewhere around the point AI Overviews reached half of all searches. The businesses that will handle the next two years well are not the ones that recover their session counts. They are the ones that stop reporting sessions as the headline and start measuring the enquiries they are still getting.
Do the divergence chart this week. Sessions and enquiries, indexed to 100, same axes. It takes ten minutes and it will either confirm that your marketing is fine and your reporting is broken, or it will show you a real problem you can then go and solve. Either outcome is worth far more than another month of arguing about a traffic graph.
What to do this week
Build the divergence chart and add a how did you hear about us field to your enquiry form. Between them, those two things will tell you whether your traffic decline is a commercial problem or a measurement one.
What to do this quarter
Rebuild the headline report around qualified enquiries, instrument every enquiry route including phone, and re-baseline your comparisons so you stop measuring against a period that no longer exists.